
Risk Indicators for Transformational AI
An early draft of a framework for indicators pointing to transformational AI


Executive Summary
Transformative AI (TAI) – AI systems whose deployment measurably reshapes labor markets, rent distribution, sector composition and productivity metrics – could emerge abruptly. Policymakers therefore need leading indicators (Key Risk Indicators, KRIs) that fire years before conventional economic statistics move. In this paper, we review ten past technological revolutions, and determine the most similar cases (the telegraph, the telephone, computers, the Internet, smartphones). We then extract the indicators that preceded each of those and map them onto a five‑phase timeline that runs from early scientific breakthroughs to labor‑market upheaval. We then translate each historical signal into an AI‑era metric, filtering for its informational value and data availability. Finally, we display what a draft TAI KRI Index with horizon‑adjusted weights could look like.
1 Introduction
Transformative AI – a term introduced by Karnofsky (2016) defined it as AI that precipitates a societal transition on the scale of the agricultural or industrial revolution. Forecasts for Transformative AI (TAI) range from “this decade” to “never” (Grace et al., 2024) Some forecasters assign >50 % probability to TAI‑scale impact within a decade; others deem such horizons highly speculative. History shows, however, that every general‑purpose technology (GPT) left identifiable precursors years before aggregate statistics budged. Codifying such precursors into Key Risk Indicators (KRIs), can give regulators, firms, and civil society time to respond. This paper offers a structured methodology to construct a set of indicators for TAI. We articulate an evidence‑based pathway – from historical GPT case studies, through indicator extraction and filtering, to an AI‑specific early‑warning index.
2 Method
Our goal is to transform a sprawling set of historical clues into a concise, data‑ready suite of early‑warning indicators for Transformative AI. We therefore run every candidate signal through a multi‑step filtering pipeline.
Step 1 – Relevance screening
We begin by identifying ten GPTs, each rich in anecdotal and quantitative evidence, from the printing press to the Internet. For every case, we ask two questions: “Is the technology primarily information-driven?” and “Does it offer observable, time‑stamped precursors that somewhat resemble today’s AI dynamics?” Technologies that fail either test – such as mechanized agriculture, which hinges on heavy machinery and slow rural diffusion – are set aside. This step narrows the long list of ten to five information‑centric revolutions that are most analogous to AI: the telegraph, the telephone, electronic computers, the Internet and smartphones.
Step 2 – Indicator extraction
Next, we inventory documented precursors for those five cases, ranging from patent surges to labor protests. For each, we record the earliest date they became visible. This yields a longlist of potential indicators.
Step 3 – Informational value filter
The longlist contains redundancies. Patent counts and inventor headcount, for instance, track similar phenomena. To avoid double‑counting, we look for overlapping metrics and drop the least distinctive metrics. We also analyze indicators for their lead time versus reliability. Single laboratory breakthroughs often gave decades-early signals that did not reliably lead to immediate impact, a lesson consistent with findings that very early signals risk false positives (Borio & Drehmann, 2009). These are deprioritized in favor of broader measures.
Step 4 – Phase grouping
Since the indicators are of different kinds, they will be more or less relevant at different phases ahead of TAI. We therefore organize them into five chronological phases that capture at which stage they are most relevant. These phases can then be weighted differently by stakeholders with different timeframes.
Step 5 – AI translation
Finally, we translate the indicators to modern analogues and check that they can be harvested at least quarterly from publicly verifiable sources. We adopt a structured-analogy approach (Green & Armstrong, 2007) to map, for example, 15th-century patent surges onto 21st-century AI patent trends. Patent surges map cleanly to AI‑related filings in WIPO and USPTO data; congressional telegraph grants translate to today’s sovereign AI compute subsidies; message tariff collapses become token‑pricing curves in model APIs. Our methodology echoes the “life-cycle analogy” method in forecasting, which assumes comparable metrics will follow similar trajectories across technologies (Nagy et al., 2013). Indicators lacking a credible present‑day counterpart, or whose modern data stream is gated or sporadic, are discarded. What remains is a balanced portfolio spanning five temporal phases, each populated by metrics that are both historically grounded and operationally measurable today.
Step 6 – Weighting
Finally, we assign weights based on the horizon, which yields a composite dashboard.
Running the long list through these sieves converts diffuse historical insight into a compact, actionable dashboard tailored to the unique facets of Transformative AI.
3 Definitions
Transformative AI (TAI): For the purposes of this paper, AI should be deemed transformative when, within a decade, it jointly triggers:
Trend‑breaking productivity gain (multi‑factor productivity step‑up).
Sectoral reallocation (AI intensive sectors gaining relative share).
Labor market shift transformation (large shift into AI‑complementary roles while routine cognitive jobs shrink).
Factor income redistribution (noticeable swing in labor-capital shares or firm level concentration).
Key Risk Indicator (KRI): A forward‑looking metric that, when it breaches a threshold, materially raises the probability that TAI will satisfy the yard‑stick within the planning horizon. Leading indicators are forward-looking metrics that tend to move in advance of broader economic changes, providing an early signal of turning points (Stock & Watson, 1989). Key Risk Indicators (KRIs) are essentially leading indicators of risk – metrics designed to alert decision-makers to rising threat levels before adverse outcomes materialize (MetricStream, 2022).
4 Case‑Study Selection
4.1 Long List of 10 GPTs
4.1.1 Printing Press (15th century)
Gutenberg’s fusion of movable metal type, oil‑based inks, and the screw press around 1440 slashed the cost of book production by more than an order of magnitude (Dittmar, 2011). Demand was primed by expanding universities, rising urban literacy, cheaper paper and over‑stretched monastic scribes. Investor backing from Johann Fust, a flurry of copycat workshops, and rapid diffusion signaled an information revolution that reshaped religion, science, and commerce.
4.1.2 Textile Mechanization (18th–early 19th centuries)
Britain’s cotton boom collided with labor bottlenecks, prompting a cascade of inventions, e.g., the flying shuttle, the spinning jenny and the water frame. Patents, mill construction and specialized machine shops showed capitalization, while thread prices collapsed and factory employment of women and children surged (Allen, 2009). Luddite riots, parliamentary factory acts and explosive export growth confirmed a full industrial take‑off.
4.1.3 Telegraph (1830s–1860s)
Building on electromagnetism discoveries, at least sixty inventors raced to patent electric telegraphs. U.S. congressional funding for the Washington–Baltimore line (1843) and British railway investment supplied capital. Message tariffs plunged, Western Union strung tens of thousands of miles of wire and a new occupation – telegraph operator – proliferated (Bryant, 2018). Nationalization debates and the 1865 founding of the International Telegraph Union underscored its status as critical infrastructure.
4.1.4 Telephone (1870s–1900s)
Simultaneous invention and fierce patent battles (Bell vs. Gray) prefaced rapid capital flows into telephone exchanges. Handset prices fell, subscription numbers soared and armies of female switchboard operators emerged (González, 2024). Regulators grappled with monopoly power as AT&T consolidated, cementing the telephone as a ubiquitous, real‑time communication layer.
4.1.5 Office Mechanization (late 19th–early 20th centuries)
Typewriters, adding machines and filing systems answered the paperwork explosion of expanding corporations. Patents and World Fair demos drove adoption; and clerical employment – especially of women – rose significantly between 1880 and 1920. Productivity metrics (words per minute, ledger postings per hour) validated the shift, and “scientific management” formalized the machine‑centric office (Yates, 1989).
4.1.6 Computers (1940s–1960s)
Wartime code‑breaking spawned electronic computing; post‑war defense contracts poured billions into mainframes. Moore’s‑law cost curves made transistors cheap and firms like IBM globalized data‑processing. Programmer and systems‑analyst roles skyrocketed, corporate data‑processing departments appeared and by the mid‑1990s national productivity statistics finally reflected the digital dividend (Oliner & Sichel, 2000).
4.1.7 Mechanized Agriculture (19th–20th centuries)
Labor shortages and rising wages drove the adoption of mechanical reapers, steam threshers and ultimately gasoline tractors (Olmstead & Rhode, 2008). Tractor counts soared while horse populations and farm labor plummeted. Government extension services and wartime incentives accelerated diffusion, yielding dramatic yield gains and freeing workers for industrial employment.
4.1.8 Assembly Line (1910s)
Interchangeable parts and flow‑production ideas culminated in Ford’s moving assembly line in 1913. Chassis build time fell from 12½ hours to 93 minutes and Model T prices collapsed (Hounshell, 1984). Labor turnover forced Ford’s famous $5‑day wage, signaling organizational upheaval. Copycat adoption across industries and rising unionization cemented mass production’s dominance.
4.1.9 Smartphones (2001–2013)
Converging advances – 3G networks, touchscreens, lithium‑ion batteries – set the stage. BlackBerry proved mobile email demand and Apple’s iPhone (2007) merged phone, web and media. Handset ASPs fell, app‑store ecosystems boomed and mobile‑developer jobs multiplied. Spectrum auctions, privacy debates and antitrust probes marked institutional reactions, as global penetration grew unabated (Comscore, 2017).
4.1.10 Internet (1990–2000)
The World Wide Web and Mosaic browser ignited user adoption and NSFNET’s commercial opening spurred backbone investment. VC funding for dot‑coms exploded, dial‑up prices dropped and domain registrations went exponential (Roser, 2018). The 1996 U.S. Telecom Act and EU e‑commerce directives addressed emerging policy gaps, and web‑developer employment and media hype signaled a full‑blown digital transition.
4.2 Shortlist of 5 GPTs
From the full list of these ten technological revolutions, we keep the five whose context most closely mirror the dynamics of AI and whose precursor data are rich enough for quantitative tracking. The printing press, textile mechanization, mechanized agriculture and the assembly line either unfolded over many decades, relied on physical capital that has no close analog to digital compute or lack high‑frequency historical metrics. In contrast, the telegraph, telephone, computers, the Internet and smartphones are all information‑centric platforms, show clear phase‑by‑phase lead indicators and have archival series (patent filings, capital expenditure, price curves, regulatory dockets and labor statistics) – that can be matched to modern AI equivalents. Keeping these five ensures our KRI framework is grounded in precedents that best reflect the tempo, network effects and intangible capital profile of Transformative AI.
5 Indicator Set Creation
5.1 Long list
Drawing on the case studies, we extract observable precursor signals. A longlist of potential indicators is presented in table 1, organized by type.
Legal
Legislative or regulatory docket items opened per quarter (e.g., wire nationalization debates)
Landmark court rulings (e.g., AT&T rate cases)
Litigation (e.g., Bell v Gray, Unix copyright fights)
Government
Government R&D contracts bankrolling prototypes (e.g., U.S. Army SAGE computers, DoCoMo R&D grants for i‑mode)
Government procurement spend on the technology (e.g., defense mainframes)
Government white papers on societal impact
Public subsidies and guaranteed loans (e.g., Congressional $30 k telegraph line)
Sovereign or central‑bank purchases of the technology (e.g., teleprinter lines)
Export controls or spectrum auctions introduced
Scientific
Breakthrough academic publications (e.g., Turing 1936; IETF RFC surge, 1992‑94)
Patent‑application spikes (e.g., electric‑telegraph patents in the 1830s, multitouch or mobile‑OS filings pre‑2007)
Prototype facilities brought on‑line (e.g., first telephone exchanges, Cambridge EDSAC computer room)
Cost
Availability of critical input components (e.g., cheap paper, reliable vacuum tubes, mass‑produced ARM SoCs)
Inflation‑adjusted unit price of the core service (e.g., telegram per ten words, monthly phone subscription)
Cost per relevant hardware metric (e.g., wire‑install cost, $/transistor, handset average selling price)
Ancillary component price drops (e.g., lithium‑ion batteries, DRAM, SSDs)
Investment
Venture‑capital investment totals per quarter
Corporate cap‑ex announcements for enabling hardware (e.g., miles of wire, mainframe orders)
Company
New‑company formation counts (e.g., chartered telegraph firms)
Demand
Penetration‑rate inflection points (e.g., telephones per 100 people, broadband users, smartphone penetration)
Bottleneck indicators (e.g., network congestion incidents, message backlogs)
Enterprise
Early enterprise pilot‑project counts
Creation of specialized corporate roles or divisions (e.g., chief data‑processing officer)
Corporate policy documents on use of the technology
Standards bodies or industry consortia formed (e.g., International Telegraph Union)
Labor
New‑occupation job‑posting share (e.g., telegraph operators, web developers)
Wage‑premium trajectory for scarce new skills (e.g., switchboard operators)
Labor‑displacement protests or unionization drives
Professional‑society membership counts (e.g., Association for Computing Machinery)
Media
Demos capturing press attention (e.g., ENIAC unveiling, first public iPhone demo)
Media‑coverage volume (e.g., front‑page share)
Cultural‑works references (e.g., etiquette guides for phone callers)Table 1 | Longlist of potential indicators from historical case studies with examples
5.2 Filtering
The long list in table 1 contains many candidates, many of which overlap or lack modern data streams. We therefore run them through three filters:
Relevance to AI
Signals that do not translate cleanly to AI are dropped, such as sovereign or central‑bank purchases of teleprinter lines, which don’t have a clear analogue for AI.
Informational Value
Ones with significant overlap are removed. Examples include new prototype facilities brought online, which are highly overlapping with capex and can be removed.
Data Accessibility
We verify that each metric can be harvested at least quarterly from public sources like WIPO, SEC, or LinkedIn. For example, professional society membership counts and government white papers on societal impact do not have standard release timing or global coverage, so are removed.
5.3 Organizing the Indicators into Chronological Phases
The indicators that withstand our three filters can be organized into five temporal buckets for ease of tracking. Each bucket captures a distinct moment in the run‑up to a technology shock, as documented in the Tier 1 case studies. Together they form a timeline that analysts can read like a seismograph.
5.3.1 Phase 1 – Scientific and Technological Enablers (lead: six to ten years)
Every technological revolution starts with a cascade of breakthroughs inside laboratories and patent offices. In the 1830s, a flurry of electric telegraph patents appeared within two years of one another; by 1876 Alexander Graham Bell and Elisha Gray raced to file telephone applications on the very same day; wartime Britain and the U.S. poured money into the first electronic computers; the early 1990s saw an explosion of IETF RFCs and Tim Berners‑Lee’s web protocols; and between 2001 and 2006 handset vendors piled up multitouch and mobile‑OS patents. Across all five cases, simultaneous invention, fast‑rising forward‑citation counts and government prototype grants marked the moment when the technical puzzle was largely solved, but commercial payoff was still years away.
5.3.2 Phase 2 – Capital Formation and Infrastructure Build‑out (lead: four to seven years)
Once feasibility is evident, capital starts rushing in. Congress’s 1843 grant for the Washington‑Baltimore telegraph line unleashed private investment that wired tens of thousands of miles within a decade. Bell Telephone and rival firms raised millions to string trunk lines by the 1880s. After ENIAC’s public unveiling, defense agencies ordered mainframes and IBM committed unprecedented capex to semiconductors. The mid‑1990s dot‑com boom funded backbone fiber around the globe, and the mid‑2000s app‑economy VC wave financed cloud servers and 3G roll‑outs. In each case a surge of venture dollars, public subsidies and large fixed‑asset announcements signaled that stakeholders were betting real resources on a coming revolution.
5.3.3 Phase 3 – Cost and Accessibility Inflection (lead: two to five years)
A breakthrough becomes disruptive only once its unit cost collapses. Telegram tariffs per ten words fell drastically in the 1850s, making rapid communication affordable to merchants as well as diplomats. Monthly phoneline subscriptions and handset prices dropped steadily in the 1890s, widening adoption beyond big business. Transistor costs halved every eighteen months, driving mainframes from military labs into corporate data processing rooms. Dial‑up Internet access fell below the price of a daily newspaper and broadband bandwidth prices plunged in the late 1990s. Smartphone average selling prices more than halved within years of launch. Each price bend coincided with a spike in penetration: operator counts, installed lines, connected hosts or handset sales.
5.3.4 Phase 4 – Institutional Reaction (lead: zero to three years)
Cheap access forces governments to respond. Britain nationalized its telegraph operators in 1870, turning the network into state infrastructure. U.S. and European regulators opened telephone rate cases and, in some cities, experimented with municipal ownership. By the late 1950s, corporations created dedicated data‑processing divisions and Congress convened hearings on automation’s labor impact. The 1996 Telecommunications Act rewrote U.S. communications law to account for the Internet, while spectrum auctions and mobile‑privacy bills proliferated as smartphones went mass‑market. Creation of new executive roles, public‑sector procurement surges, regulatory dockets and standards bodies all mark this fourth phase.
5.3.5 Phase 5 – Labor Market and Media Upheaval (lead: minus one to plus one year)
The final signals are visible on the street. Telegraphy produced a brand‑new occupation – wire operators – whose wages briefly outstripped many industrial jobs. Telephone switchboards employed armies of young women and obliterated messenger services. Programmers and systems analysts became some of the fastest‑growing occupations of the 1960s while routine clerical roles declined. Web‑developer postings exploded after 1995, and mobile‑app developer counts followed suit post‑2008. Each wave generated a surge in media coverage and cultural references: newspapers marveled at the “annihilation of distance, magazines put “electronic brains” on their covers, TV-shows built plots around dot‑com riches and later around mobile apps. By the time these signals flash, the macro changes are usually just around the corner.
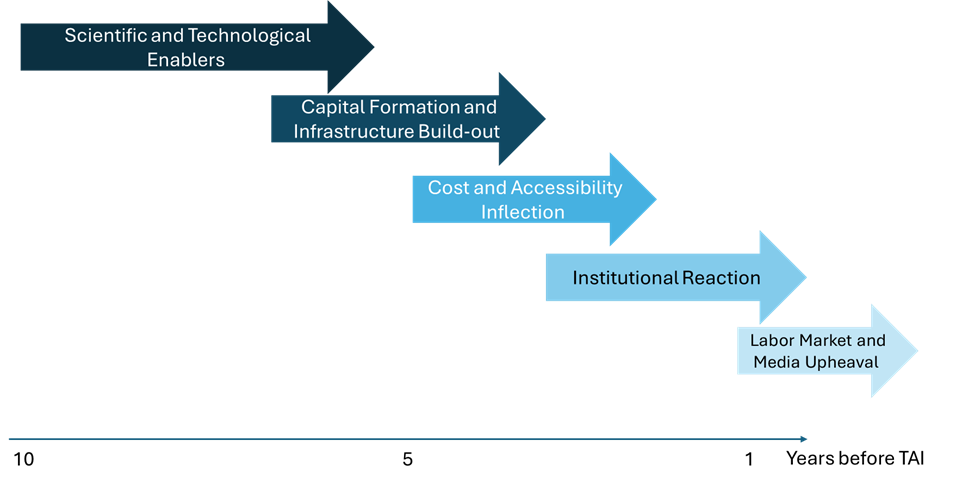
Figure 1 | Phases Leading up to TAI
Together, these five phases form a durable chronology with a cascading alarm system. Early indicators are noisy but offer the most lead time, while late indicators are near‑certain but leave little room for maneuver.
5.4 Translating Remaining Indicators into AI‑Specific Metrics
Having trimmed the historical signals to those both relevant and data‑accessible, we now convert each one into a metric that tracks the same underlying dynamic for AI. The translation follows three rules. First, every metric must be available at least quarterly from a public or low‑cost source such as WIPO, SEC filings, or widely scraped job boards. Second, it must echo the original signal’s economic meaning – patents map to patents, tariffs to usage prices, regulatory dockets to AI‑specific bills, etc. Third, where history offers multiple possible analogues (for example, wire mileage versus GPU counts for capital intensity), we choose the measure with the longest time series and the lowest definitional ambiguity. The outcome is a streamlined, AI‑ready indicator set that slots smoothly into the five‑phase chronology.
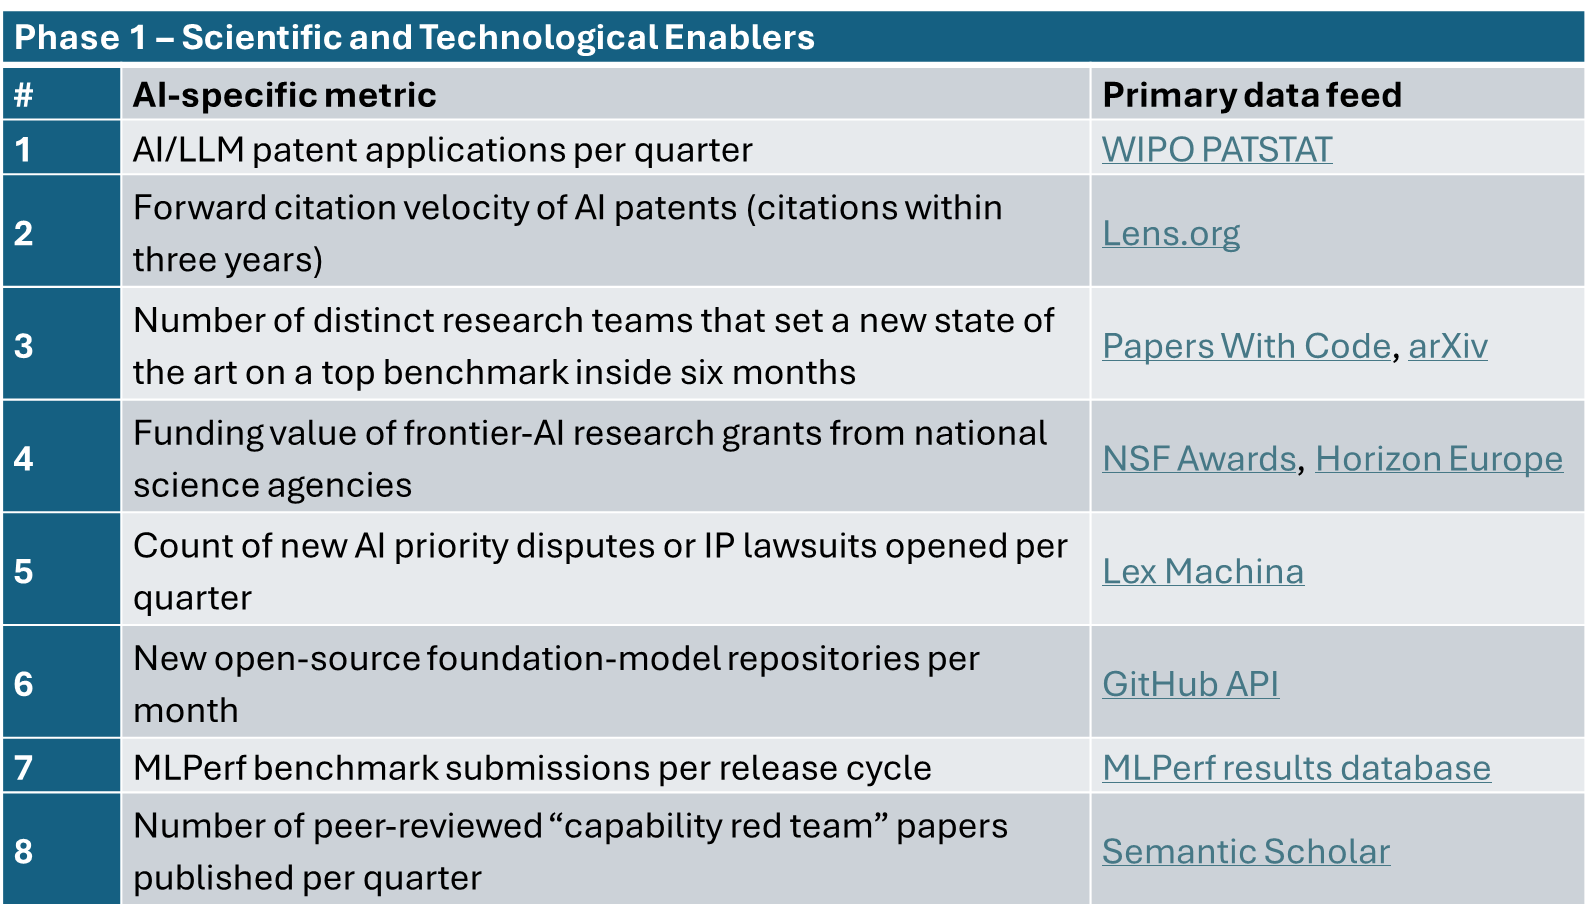
Table 2 | AI-specific Metrics Phase 1
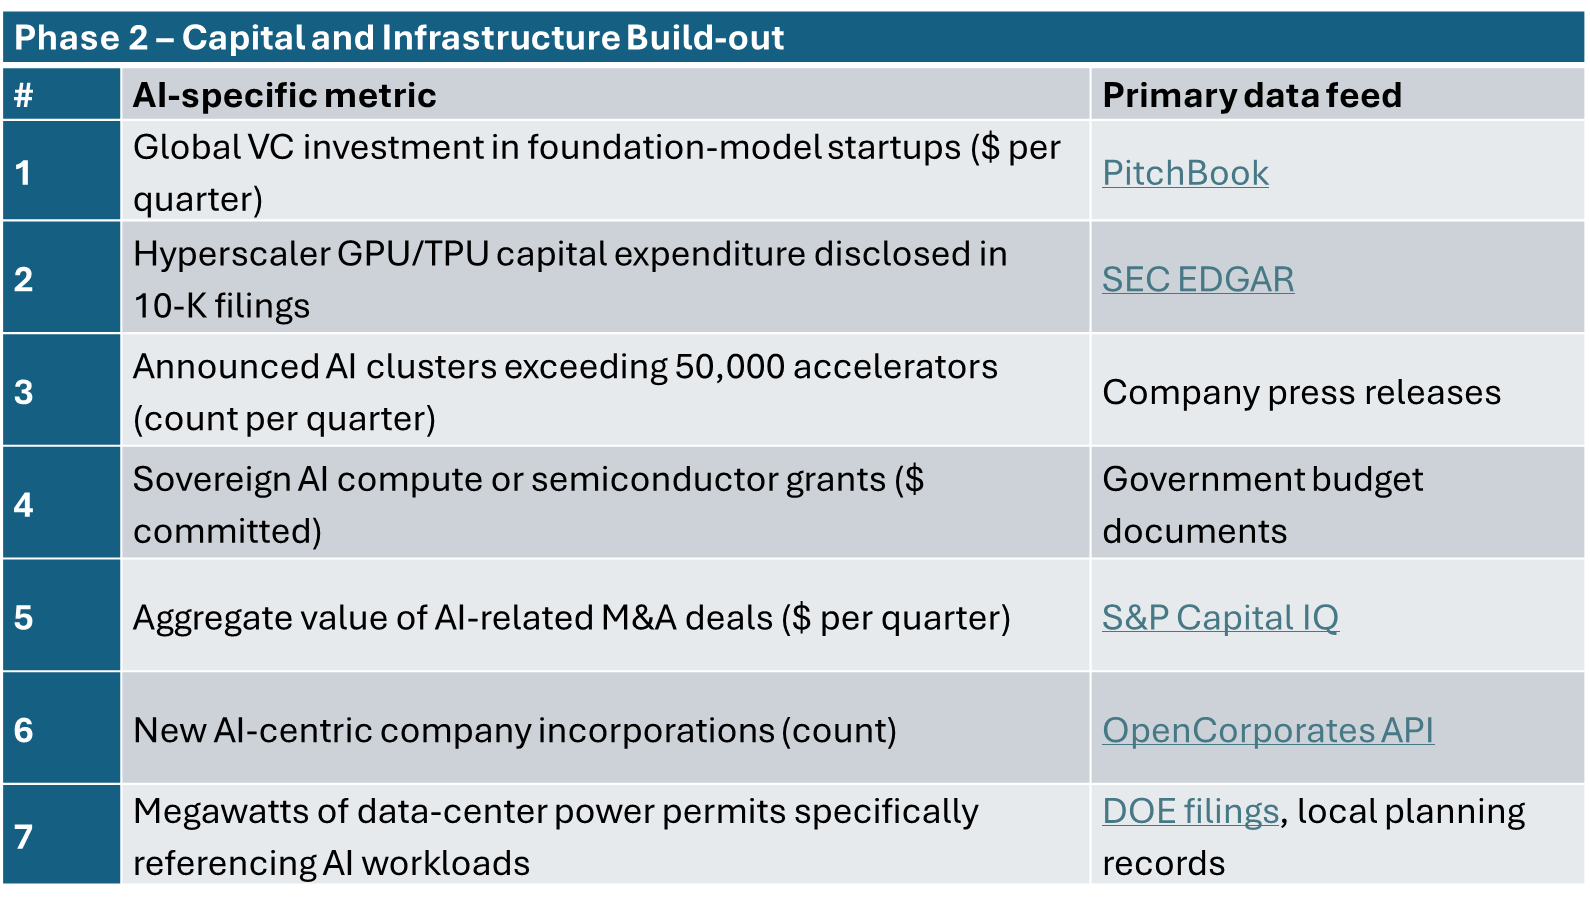
Table 3 | AI-specific Metrics Phase 2
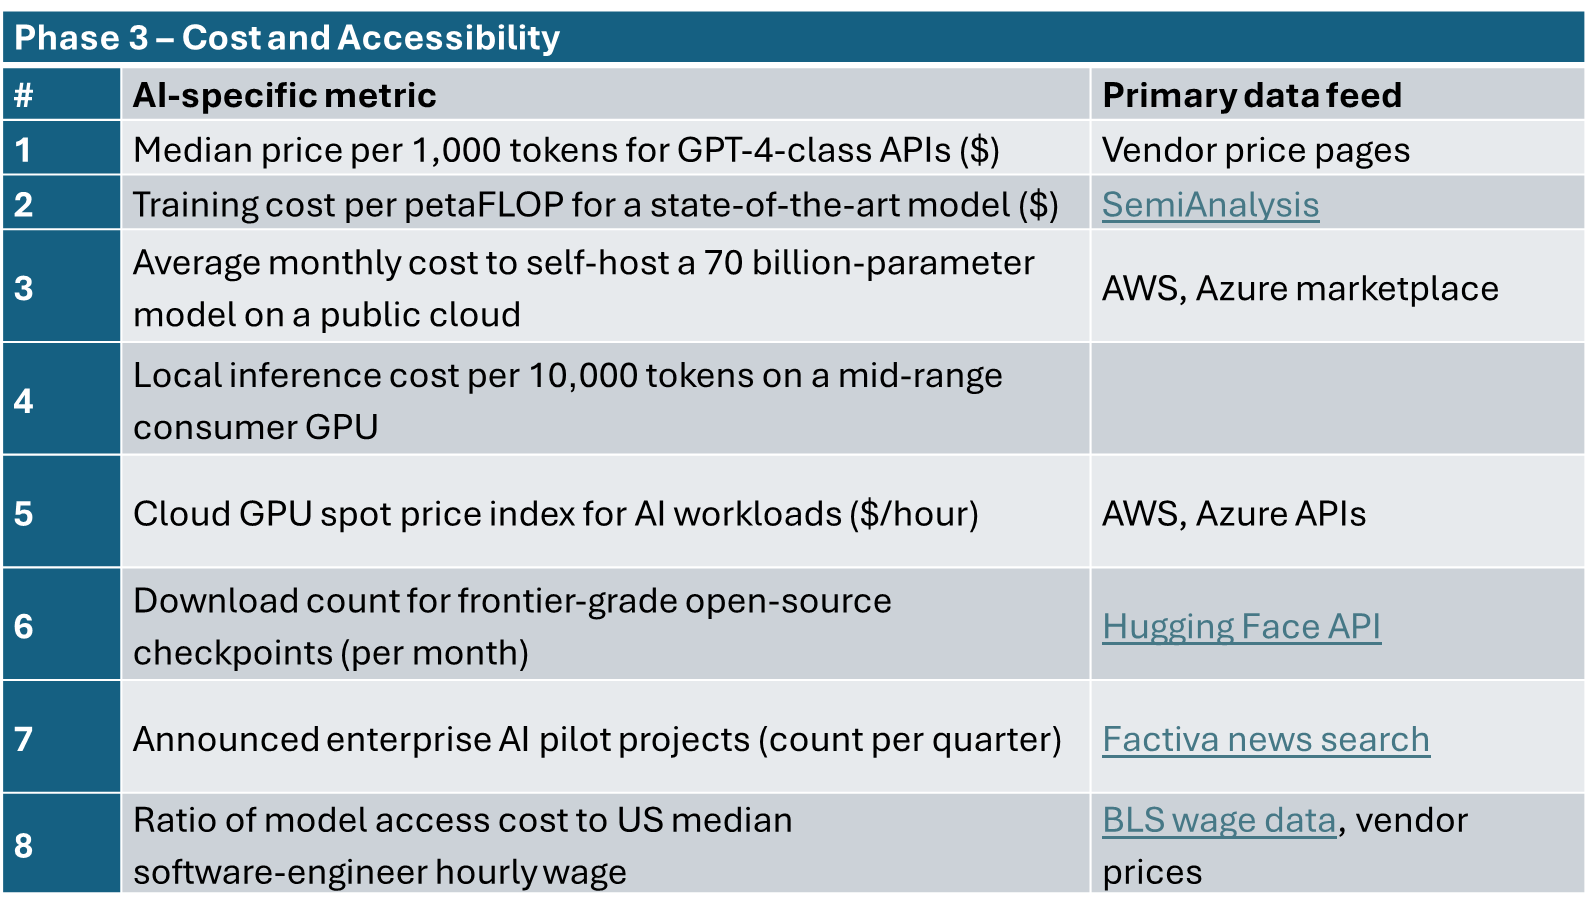
Table 4 | AI-specific Metrics Phase 3
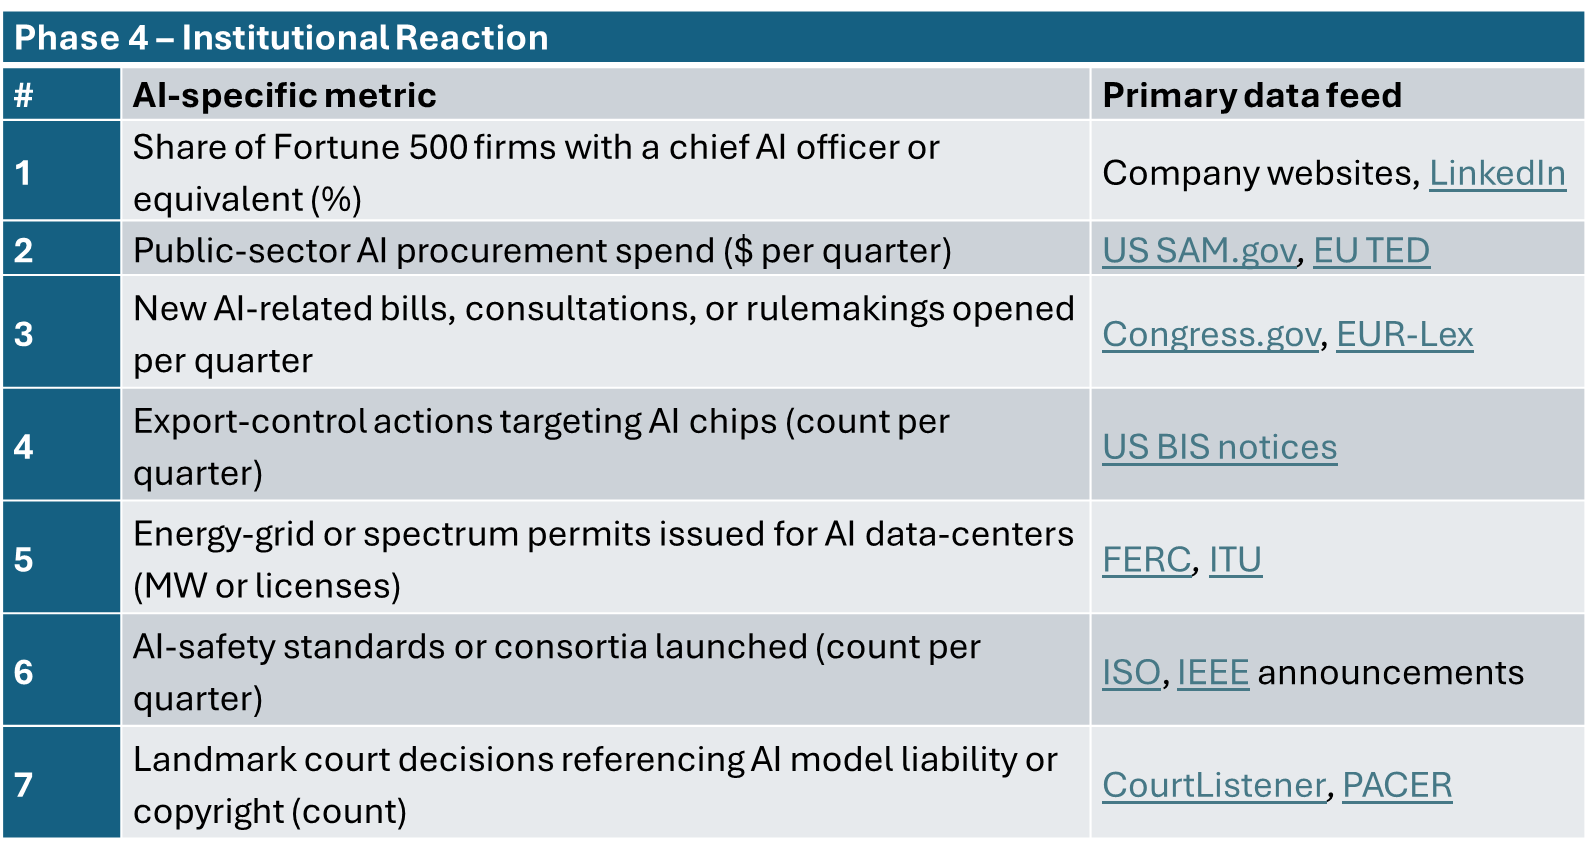
Table 5 | AI-specific Metrics Phase 4
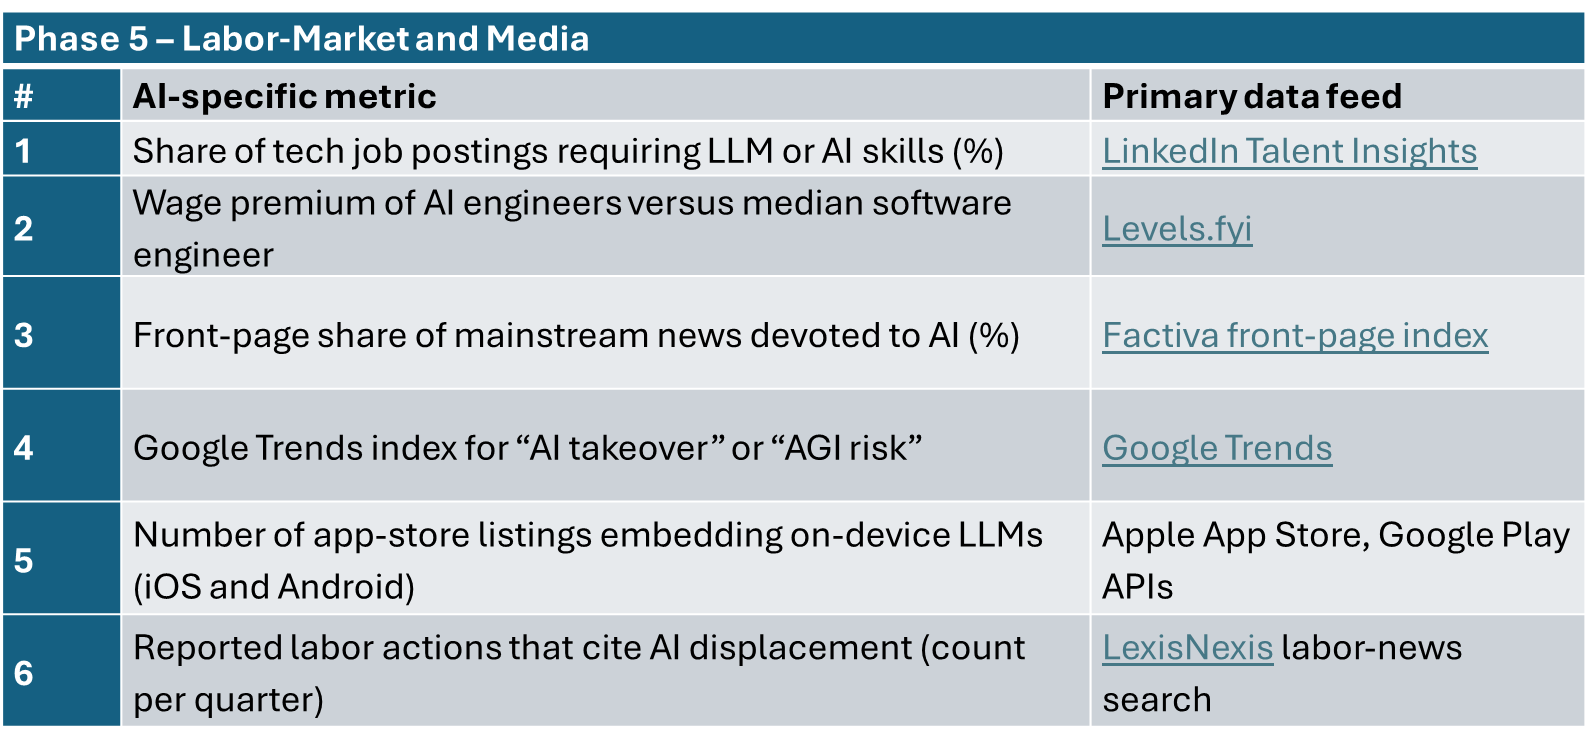
Table 6 | AI-specific Metrics Phase 5
5.5 Dynamic Weighting Strategy
The final thing to note is that each indicator does not carry equal value at every point in time. A patent burst a decade early is informative, but once token prices collapse and regulators scramble, patents add little new signal. To capture this shifting importance, we can assign horizon‑specific weights to the indicators. Table 3 provides an example set of weightings.
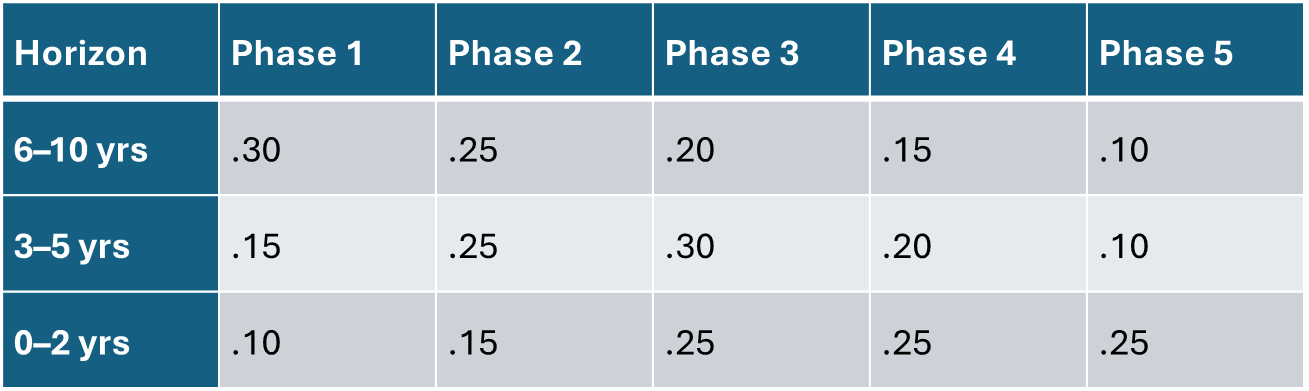
Table 3 | Indicator Weightings per Phase
The first step is to choose a planning horizon. Agencies focused on long‑term research funding may care most about a six‑to‑ten‑year lead, while workforce ministries may need a two‑year alert. The next step is to apply the relative phase weights and compute the index. This should be updated annually, by revisiting the horizon choice. If Phase 2 indicators have already spiked, a stakeholder may shift focus to Phase 3 or Phase 4, tightening the alert window. This adaptive approach keeps the index sensitive to early tremors when lead time matters most, then hands off to more reliable late‑phase signals as deployment nears, without requiring wholesale redesign.
6 Discussion
6.1 Limitations
This study deliberately favors breadth over depth, and the resulting framework carries four important caveats. First, we do not perform a formal back‑test. Although the index architecture is informed by past technology waves, we stop short of quantifying false positive and false negative rates, which leaves policy users to calibrate thresholds based on judgment. We acknowledge that our framework’s validity can only be truly known in hindsight; similar retrospective analyses (Mensch, 1979) of past industrial revolutions have highlighted both false positives and missed signals. Second, data quality is uneven across phases and geographies; venture funding and patent filings are well covered, but global statistics on AI labor demand depend on job‑board scraping that can shift when platforms change taxonomies. Third, many of the proposed indicators are proxies rather than direct measures of AI capability. A drop in token prices, for example, might signal competitive discounting as much as genuine cost efficiency. Fourth, the weighting scheme is subjective. We anchor the phase weights in historical lead times, yet those lags could compress or elongate for AI because compute, capital and data move faster today than in any prior era. Overall, history is littered with failed predictions of revolutionary tech that was “just around the corner” (Schnaars, 1994), underscoring the uncertainty inherent in TAI forecasting.
6.2 Future Work
Several extensions of this work could strengthen the analysis. The first option would be to remove some recent case studies such as the smartphone and do a quantitative back‑test against it. Reconstructing cost curves, media coverage and labor postings for smartphones would allow for estimating the index’s historical precision. Second, the framework would benefit from a causal model that links early indicators to eventual productivity outcomes, moving beyond correlation to structural inference. Third, geographic disaggregation – building separate dashboards for the United States, China, and the European Union – could reveal whether TAI emerges unevenly. Fourth, the indicator set itself should stay adaptive. Governance‑specific metrics like AI incident reports counts may grow in importance and deserve their own as the field matures. As Tetlock and Gardner (2015) note, even domain experts often badly miss long-term forecasts, so any forecasting framework must be rigorously tested and updated with new data. Finally, integrating expert‑elicited weights could replace the current static weighting grid with a system that learns which indicators best predict downstream economic impact as new data accumulate.
7 Conclusion
By triangulating five historical phases with measurable AI‑era proxies, we offer an outline of a comprehensive early‑warning toolkit for TAI. This framework helps turn abstract debate into a monitorable index, giving policymakers actionable runway to steer R&D incentives, workforce retraining and safety regulation before the macro shock of TAI arrives.
Bibliography
Aldasoro, I., Borio, C., & Drehmann, M. (2018). Early warning indicators of banking crises: expanding the family. BIS Quarterly Review, March 2018, 29–45.
Allen, R. C. (2009). The British Industrial Revolution in Global Perspective. Cambridge University Press.
Bryant, A. (2018). The Great Telegraph Breakthrough of 1866. Federal Reserve Bank of Richmond – Econ Focus, 2Q 2018, 32–35.
Comscore. (2017, June 28). U.S. smartphone penetration surpassed 80 percent in 2016.
Dittmar, J. (2011). Information Technology and Economic Change: The Impact of the Printing Press. Quarterly Journal of Economics, 126(3), 1133–1172.
Dortmans, P. J., & Eiffe, E. (2004). An examination of future scenarios using historical analogy. Futures, 36(10), 1049–1062.
González Jurado-Gutiérrez, G. (2024, April 19). The telephone: From the 19th century revolution to the digital age. Telefónica.
Grace, K., et al. (2024). Thousands of AI Authors on the Future of AI (Survey Report). arXiv:2401.02843 [cs.CY].
Green, K. C., & Armstrong, J. S. (2007). Structured analogies for forecasting. International Journal of Forecasting, 23(3), 365–376.
Hounshell, D. A. (1984). From the American System to Mass Production, 1800-1932. Johns Hopkins University Press.
Karnofsky, H. (2016). Some Background on Our Views Regarding Advanced Artificial Intelligence. Open Philanthropy (Blog).
Mensch, G. (1979). Stalemate in technology: Innovations overcome the depression. Ballinger Publishing Company.
MetricStream. (2022). The power of key risk indicators (KRIs) in ERM. MetricStream, Inc.
Nagy, B., Farmer, J. D., Bui, Q. M., & Trancik, J. E. (2013). Statistical basis for predicting technological progress. PLOS ONE, 8(2), e52669.
Oliner, S. D., & Sichel, D. E. (2000). The resurgence of growth in the late 1990s: Is information technology the story? Journal of Economic Perspectives, 14(4), 3–22.
Olmstead, A. L., & Rhode, P. W. (2008). Creating Abundance: Biological Innovation and American Agricultural Development. Cambridge University Press.
Roser, M. (2018). The internet’s history has just begun. Our World in Data.
Schnaars, S. P. (1994). Megamistakes: Forecasting and the Myth of Rapid Technological Change. Free Press.
Stock, J. H., & Watson, M. W. (1989). New indexes of coincident and leading economic indicators. In O. J. Blanchard & S. Fischer (Eds.), NBER macroeconomics annual 1989 (Vol. 4, pp. 351–394). MIT Press.
Tetlock, P. E., & Gardner, D. (2015). Superforecasting: The art and science of prediction. Crown.
Yates, J. (1989). Control through communication: The rise of system in American management. Johns Hopkins University Press.